
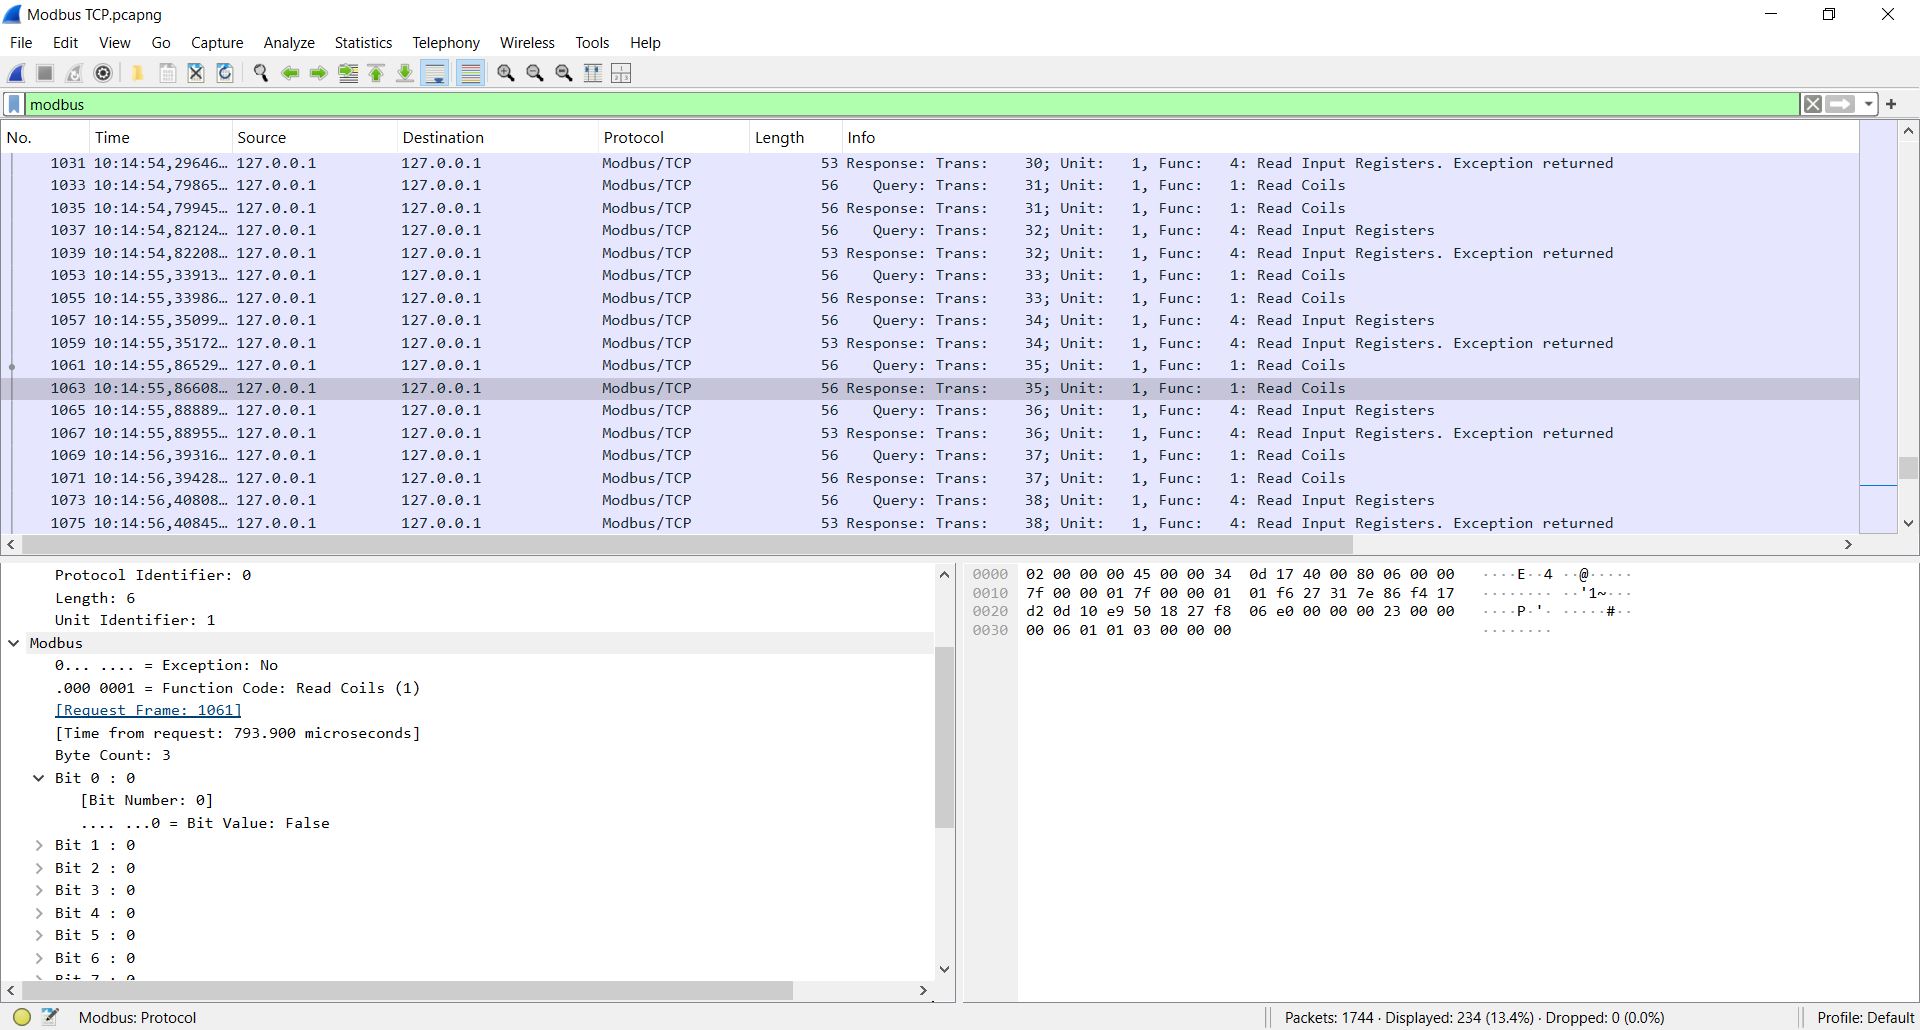
Modbus TCP is one of the easiest protocols to analyze in Wireshark. It runs on TCP port 502, uses a simple request/response pattern, and Wireshark decodes every field — MBAP header, function code, register addresses, and data values — in plain text.
But engineers still struggle with three things: finding the right display filters, understanding what a healthy vs broken Modbus conversation looks like, and diagnosing why a device is not responding.
This guide covers everything: capture setup, display filters verified against the official Wireshark reference, how to read decoded Modbus packets, and how to diagnose the 10 most common Modbus TCP problems using Wireshark.
In This Guide
1. How Modbus TCP Appears in Wireshark
Wireshark decodes Modbus TCP as two protocol layers:
| Layer | Protocol Name | What It Shows |
|---|---|---|
| Modbus/TCP (mbtcp) | MBAP header | Transaction ID, Protocol ID, Length, Unit ID |
| Modbus (modbus) | Application data | Function code, register addresses, data values, exception codes |
The Info column shows a summary like:
Query: Trans: 1; Unit: 1, Func: 3: Read Holding Registers
Response: Trans: 1; Unit: 1, Func: 3: Read Holding Registers
This tells you the transaction ID, the Unit ID (slave address), the function code, and whether it is a request (Query) or response (Response).
2. How to Capture Modbus TCP Traffic
Capture Filter (Before Starting Capture)
To capture only Modbus TCP traffic:
tcp port 502This reduces file size and makes analysis faster.
Where to Capture
| Location | When to Use |
|---|---|
| On the SCADA server or PLC | Best view of all Modbus communication from the master |
| On the Modbus device | Only if the device supports packet capture |
| On a network switch (port mirroring) | When you cannot install Wireshark on the SCADA server |
| On a network TAP | For non-intrusive capture between master and slave |
Start Capture
- Open Wireshark → select the network interface connected to the Modbus network
- Enter the capture filter
tcp port 502 - Click Start
- Let it run for at least one full poll cycle (usually 5–30 seconds)
- Stop the capture and save the file
3. Decoding Modbus on Non-Standard Ports
Wireshark only decodes Modbus automatically on port 502. If your device uses a different port (e.g., 1502, 5020, 8502), Modbus packets will appear as raw TCP data.
Fix: Use “Decode As”
- Right-click on a packet that should be Modbus
- Select Decode As…
- In the table, set: Field = TCP port, Value = your port number, Current = MBTCP
- Click OK
Now Wireshark decodes all traffic on that port as Modbus TCP.
Fix: Change Preferences
- Go to Edit → Preferences → Protocols → Modbus/TCP
- Change the Modbus TCP Port value to your custom port
- Click OK
4. Display Filters for Modbus TCP
All filter field names verified against the official Wireshark Display Filter Reference: modbus and mbtcp.
Basic Filters
| Filter | What It Shows |
|---|---|
modbus | All Modbus traffic (requests + responses) |
mbtcp | All Modbus/TCP MBAP headers |
tcp.port == 502 | All traffic on port 502 (including TCP handshake) |
tcp.dstport == 502 | Only requests sent to Modbus servers |
tcp.srcport == 502 | Only responses from Modbus servers |
Function Code Filters
| Filter | What It Shows |
|---|---|
modbus.func_code == 3 | Read Holding Registers (FC 03) |
modbus.func_code == 4 | Read Input Registers (FC 04) |
modbus.func_code == 6 | Write Single Register (FC 06) |
modbus.func_code == 16 | Write Multiple Registers (FC 16) |
modbus.func_code == 1 | Read Coils (FC 01) |
modbus.func_code == 5 | Write Single Coil (FC 05) |
modbus.func_code >= 128 | All exception responses (FC + 0x80) |
MBAP Header Filters
| Filter | What It Shows |
|---|---|
mbtcp.trans_id | Filter by Transaction ID |
mbtcp.prot_id | Protocol ID (always 0 for Modbus) |
mbtcp.len | MBAP Length field |
mbtcp.unit_id | Unit ID (slave address) |
mbtcp.unit_id == 1 | Only traffic to/from Unit ID 1 |
Data and Register Filters
| Filter | What It Shows |
|---|---|
modbus.reference_num | Register address (starting address) |
modbus.reference_num == 100 | Requests targeting register 100 |
modbus.word_cnt | Number of registers requested |
modbus.byte_cnt | Byte count in response |
modbus.data | Raw data bytes in response |
modbus.exception_code | Exception code in error responses |
modbus.exception_code == 2 | Illegal Data Address exceptions only |
Combination Examples
Traffic to a specific device:
modbus && ip.addr == 192.168.1.100Only exception responses from any device:
modbus.func_code >= 128Only FC 03 requests to Unit ID 5:
modbus.func_code == 3 && mbtcp.unit_id == 5Slow responses (gap > 1 second):
modbus && frame.time_delta > 15. How to Read a Decoded Modbus Packet
Click on a Modbus packet in Wireshark. The packet detail pane shows two sections:
Modbus/TCP Section (MBAP Header)
Modbus/TCP
    Transaction Identifier: 1
    Protocol Identifier: 0
    Length: 6
    Unit Identifier: 1
Modbus Section (PDU)
For a Read Holding Registers request:
Modbus
    Function Code: Read Holding Registers (3)
    Reference Number: 100
    Word Count: 10
For the response:
Modbus
    Function Code: Read Holding Registers (3)
    Byte Count: 20
    Register 100 (UINT16): 2301
    Register 101 (UINT16): 2295
    Register 102 (UINT16): 2310
    ...
Wireshark automatically matches each Transaction ID in the request to the corresponding response. You can see the matched pair by looking at the Transaction Identifier.
6. What a Healthy Modbus Conversation Looks Like
A healthy Modbus TCP session shows this pattern:
| # | Direction | Info |
|---|---|---|
| 1 | Client → Server | TCP SYN |
| 2 | Server → Client | TCP SYN-ACK |
| 3 | Client → Server | TCP ACK |
| 4 | Client → Server | Query: Trans: 1; Unit: 1, Func: 3: Read Holding Registers |
| 5 | Server → Client | Response: Trans: 1; Unit: 1, Func: 3: Read Holding Registers |
| 6 | Client → Server | Query: Trans: 2; Unit: 1, Func: 3: Read Holding Registers |
| 7 | Server → Client | Response: Trans: 2; Unit: 1, Func: 3: Read Holding Registers |
| … | … | … repeats every poll cycle |
Key signs of healthy communication:
- Every Query has a matching Response with the same Transaction ID
- Transaction IDs increment sequentially (1, 2, 3, …)
- Response follows request within milliseconds (typically < 100 ms)
- No TCP retransmissions
- No exception responses
7. Diagnosing No Response from a Device
Symptom: SCADA shows “Timeout” or “No response.” Wireshark shows the request but no response.
What to Look For
Filter: modbus && ip.addr == <device IP>
| What You See | Cause | Fix |
|---|---|---|
| Query sent, no Response packet | Device is not reachable or not listening | Ping the device. Check cable. Verify port 502 is open. |
| TCP SYN sent, no SYN-ACK | Device is offline or firewall blocks port 502 | Check power. Check firewall rules. |
| TCP SYN-ACK received, then Query sent, no Response | Device accepts TCP but Modbus service is not running | Enable Modbus TCP in device configuration. |
| Query sent, TCP RST received | Device actively refused the connection | Modbus service disabled, or max connections exceeded. |
Quick Check
Filter for TCP problems:
tcp.analysis.retransmission && tcp.port == 502If you see retransmissions, the network is losing packets or the device is not responding.
8. Diagnosing Exception Responses
Symptom: SCADA shows an error code. Wireshark shows a Response with function code ≥ 128.
Filter: modbus.func_code >= 128
Or filter by specific exception code: modbus.exception_code == 2
| Exception Code | Name | Meaning | Common Cause |
|---|---|---|---|
| 01 | Illegal Function | Device does not support this FC | Using FC 04 on a device that only supports FC 03 |
| 02 | Illegal Data Address | Register does not exist | Wrong register address, off-by-one error |
| 03 | Illegal Data Value | Value out of range | Writing 0x0001 to a coil (must be 0xFF00) |
| 04 | Slave Device Failure | Internal device error | Hardware fault in the device |
| 06 | Slave Device Busy | Device is processing another request | Too many requests too fast. Slow down poll rate. |
Exception 02 (Illegal Data Address) is the most common. It usually means the register address in the request does not match the device’s register map. Check the zero-based offset — register 40001 = PDU address 0x0000.
For a full guide, see: Modbus Function Codes Explained
9. Diagnosing Slow Responses and Timeouts
Symptom: SCADA reads data but values update slowly, or occasional timeouts occur.
Measure Response Time
Add a custom column: right-click column header → Column Preferences → add frame.time_delta_displayed as “Delta Time.”
Now you can see the time between each packet. A healthy response arrives within 10–100 ms. If responses take 500 ms or more, something is wrong.
Filter for Slow Responses
modbus && frame.time_delta > 0.5Common Causes
| Symptom in Wireshark | Cause | Fix |
|---|---|---|
| Response takes > 500 ms | Device overloaded with too many requests | Reduce poll rate. Read registers in larger blocks. |
| Response takes > 1 second | Network congestion | Check network load. Move Modbus devices to a dedicated VLAN. |
| Occasional timeouts between normal responses | Connection limit exceeded — another client is competing | Reduce the number of Modbus clients connected to the device. |
| Increasing delay over time | Device memory leak or resource exhaustion | Power cycle the device. Update firmware. |
10. Diagnosing Wrong Data Values
Symptom: SCADA shows unexpected values — 0, garbage, or values that do not match the device display.
What to Check in Wireshark
- Filter:
modbus.func_code == 3(or the FC you are using) - Click on the Response packet
- Expand the Modbus section → look at the register values
| Symptom | Cause | Fix |
|---|---|---|
| Register values are correct in Wireshark but wrong in SCADA | SCADA data type or byte order misconfigured | Check UINT16 vs INT16 vs FLOAT32 in SCADA. Check byte order. |
| Register values are 0 in Wireshark | Wrong register address — you are reading empty registers | Check the device register map. Fix the zero-based offset. |
| Register values change but do not match the device display | Wrong scale factor in SCADA | Apply the correct scale factor from the register map. |
| Two registers show random-looking numbers | 32-bit float with wrong byte order | Swap the two registers (try AB CD vs CD AB). |
For a full guide on register addressing, see: Modbus Register Map Explained
11. Diagnosing Connection Drops
Symptom: Communication works for a while, then drops. SCADA reconnects after a few seconds.
What to Look For
Filter: tcp.flags.reset == 1 && tcp.port == 502
This shows all TCP RST (reset) packets on port 502. A RST means one side forcibly closed the connection.
| Pattern | Cause | Fix |
|---|---|---|
| Device sends RST after a period of inactivity | Device idle timeout is shorter than the SCADA poll interval | Reduce idle timeout on device, or poll more frequently. |
| Device sends RST when a new client connects | Max connections exceeded — device drops the oldest | Reduce the number of SCADA clients. Use a single master. |
| Client sends RST after timeout | SCADA timed out waiting for a response | Check device health. Check network path. |
| Periodic RST every N minutes | Firewall connection timeout closing idle sessions | Enable TCP keep-alive on the SCADA side. |
Also check: tcp.analysis.retransmission && tcp.port == 502 for packet loss.
12. Diagnosing Overlapping Requests
Symptom: Transaction IDs are mismatched. Responses do not match requests.
The Problem
Some Modbus clients send a new request before the previous response arrives. If the Transaction IDs get out of sync, responses are matched to the wrong requests.
What to Look For
Filter: modbus and sort by Transaction ID.
Look for:
- Two Queries with different Transaction IDs before any Response arrives — the client is sending requests too fast
- Response Transaction ID does not match the last Query — responses are out of order
Fix
Configure the SCADA master to wait for each response before sending the next request. Or enable the TCP reassembly option in Wireshark: Edit → Preferences → Protocols → Modbus/TCP → Desegment all Modbus RTU packets spanning multiple TCP segments.
13. Useful Wireshark Columns for Modbus Analysis
Add these custom columns for faster troubleshooting:
| Column Title | Type | Field Name |
|---|---|---|
| Transaction ID | Custom | mbtcp.trans_id |
| Unit ID | Custom | mbtcp.unit_id |
| Function Code | Custom | modbus.func_code |
| Register Address | Custom | modbus.reference_num |
| Delta Time | Custom | frame.time_delta_displayed |
| Source IP | Normal | ip.src |
| Destination IP | Normal | ip.dst |
To add: right-click any column header → Column Preferences → click + → set the Title and Field name.
With these columns, you can see the Transaction ID, Unit ID, FC, register address, and response time for every packet — without clicking on each one.
14. Common Modbus TCP Problems and What They Look Like in Wireshark
| Problem | Wireshark Symptom | Filter to Use |
|---|---|---|
| Device offline | TCP SYN with no SYN-ACK | tcp.flags.syn == 1 && tcp.port == 502 |
| Firewall blocking | TCP RST immediately after SYN | tcp.flags.reset == 1 && tcp.port == 502 |
| Wrong Unit ID | Query sent, no Modbus response (device ignores wrong Unit ID) | mbtcp.unit_id — check if ID matches device |
| Wrong register address | Exception code 02 in response | modbus.exception_code == 2 |
| Wrong function code | Exception code 01 in response | modbus.exception_code == 1 |
| Device overloaded | Long delays between request and response | modbus && frame.time_delta > 1 |
| Connection limit exceeded | TCP RST when connecting | tcp.flags.reset == 1 && tcp.port == 502 |
| Packet loss | TCP retransmissions | tcp.analysis.retransmission && tcp.port == 502 |
| Wrong data values | Correct register values in Wireshark but wrong in SCADA | Check data type and byte order in SCADA |
| Overlapping requests | Transaction IDs out of order | modbus — check Transaction ID sequence |
Summary
Wireshark makes Modbus TCP problems visible. Every request, every response, every exception, and every timing issue is captured and decoded.
The key things to remember:
- Use
modbusas the main display filter - Use
modbus.func_code >= 128to find all exception responses - Use
modbus.exception_code == 2for the most common error (wrong register address) - Use
frame.time_deltato measure response times and find slow devices - Use
tcp.analysis.retransmissionto find packet loss - Use
tcp.flags.resetto find connection drops - If Modbus is on a non-standard port, use Decode As → MBTCP
- Add custom columns for Transaction ID, Unit ID, and Function Code to speed up analysis
💡 Tip: Use the free Modbus Frame Decoder Tool to decode any Modbus frame byte by byte — including MBAP header, function code, register addresses, and CRC validation.