Wireshark is the go-to tool for analyzing communication protocols — and it fully supports IEC 60870-5-104 (commonly known as IEC 104).
Whether you’re diagnosing network issues, validating SCADA data, or learning how IEC 104 works, Wireshark provides an unmatched level of visibility into the protocol’s Ethernet, TCP, and ASDU layers.
This guide shows you how to capture, decode, and interpret IEC 104 frames step by step.
Table of Contents
What Is IEC 60870-5-104?
IEC 104 is a standard protocol used for telecontrol and SCADA communication over Ethernet and TCP/IP.
It is widely deployed in power automation, energy management, and industrial control systems to exchange real-time data between control centers, RTUs, and IEDs.
Wireshark can decode all key components of IEC 104 frames:
- APCI headers
- ASDU messages
- CP56Time2a timestamps
- Command and event flows
Monitoring IEC 104 Traffic Through Switch Port Mirroring (SPAN)
The most reliable and non-intrusive way to capture IEC 60870-5-104 traffic on a live SCADA network is to use a managed Ethernet switch with port mirroring (also called SPAN — Switched Port Analyzer).
IEC 104 runs over TCP port 2404, so capturing packets at the switch level gives you full visibility into every APDU, ASDU, control U-frame, and timestamped event passing through the network — without disrupting communication.
Why Use Port Mirroring?
- Allows passive monitoring of all traffic between IEC 104 clients (control centers) and servers (RTUs/IEDs).
- Zero impact on the SCADA system — no IP changes, no routing changes.
- Ideal for diagnostics, performance monitoring, and cybersecurity inspection.
- Works perfectly with Wireshark, the most widely used IEC 104 analyzer.
How Port Mirroring Works
In a typical IEC 104 network:
- Control Center (Master) communicates using TCP → port 2404
- RTUs/IEDs (Slaves) receive and send ASDUs
- The traffic flows through a managed Ethernet switch
By enabling port mirroring:
- You select the source port(s) carrying IEC 104 traffic
(e.g., control center port + RTU/IED port) - You configure a mirror/monitor port
- You plug your laptop running Wireshark into the mirror port
- You instantly see every IEC 104 frame in real time
               (SPAN / Port Mirroring Enabled)
                  +----------------------+
                  |     Managed Switch   |
                  |                      |
Control Center -->| Port 8        Port 1 |--> Laptop with Wireshark
        RTU  ---->| Port 3               |
                  +----------------------+
Supported Switches (Recommended)
Most industrial and commercial switches support port mirroring:
Industrial-Grade Switches
- Cisco Industrial Ethernet IE2000 / IE4000
- Moxa EDS-2000 / EDS-4000 Series
- Hirschmann / Belden BOBCAT, RS20, MS20
- Phoenix Contact FL Switch Series
Commercial Switches (good for labs)
- TP-Link JetStream
- Netgear ProSAFE GS108T / GS110TP
- Mikrotik CRS/Hex Series
If your current switch does not support port mirroring, you can still monitor traffic using an external network tap (inline Ethernet tap), but SPAN is usually sufficient.
Setting Up Wireshark for IEC 104 Analysis
Step 1: Install Wireshark
Download the latest version from wireshark.org.
Ensure the IEC 104 dissector is enabled by default (included in versions ≥ 2.6).
Step 2: Start Packet Capture
- Select the correct Ethernet interface connected to your SCADA network, test setup or the mirror port.
- Apply the capture filter:
tcp port 2404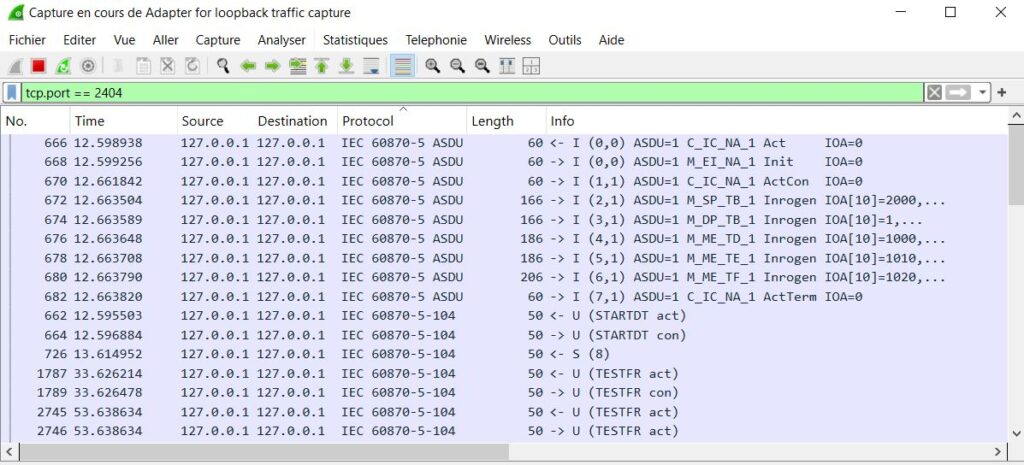
This isolates IEC 104 traffic, which always uses TCP port 2404 by default.
Step 3: Stop and Save the Capture
Once you have a few seconds of communication (start/stop frames, ASDUs, etc.), stop the capture and save the .pcap file for analysis.
Understanding IEC 104 Frame Structure in Wireshark
Each IEC 104 frame (APDU) decoded by Wireshark typically includes three major parts:
- Ethernet Header → Source & destination MAC addresses
- TCP Segment → Connection details (source/destination IP, port 2404)
- IEC 104 Protocol Layer → The actual SCADA data
Example Breakdown in Wireshark:
IEC 60870-5-104 APDU
    Start: 0x68
    Length: 15
    Control Field: 0x00000000
    Type: I-format
    Send Sequence: 36
    Receive Sequence: 20
    ASDU Type ID: 45 (Single-point information)
    Cause of Transmission: 3 (Spontaneous)
    ASDU Address: 1
    Information Object Address: 100
    Information Element: ON (1)
    Timestamp: 2025-10-30 14:15:12.987 (CP56Time2a)
Common IEC 104 Frame Types Seen in Wireshark
| Frame Type | Description | Wireshark Display |
|---|---|---|
| I-format (Information) | Carries data (ASDUs) | I-format frame |
| S-format (Supervisory) | Acknowledges received frames | S-format frame |
| U-format (Control) | Start/Stop/Test frames | STARTDT ACT/CON, STOPDT ACT/CON, TESTFR ACT/CON |
Use these frame types to interpret session states and verify link health.
Useful Display Filters for IEC 104 in Wireshark
Here are the most helpful filters to narrow down IEC 104 traffic:
| Purpose | Wireshark Filter |
|---|---|
| Show all IEC 104 frames | tcp.port == 2404 or tcp.srcport == 2404 |
| Show only I-format frames | iec60870_104.type == 0x00000000 |
| Show only S-format frames | iec60870_104.type == 0x00000001 |
| Show only U-format frames | iec60870_104.type == 0x00000003 |
| Filter by ASDU Type ID | iec60870_asdu.typeid == 30 |
| Filter by Cause of Transmission | iec60870_asdu.causetx == 3 |
| Filter by Common Address | iec60870_asdu.addr == 1 |
| Filter timestamped events | iec60870_asdu.cp56time == "2025-10-31 09:51:19.286000000+0100" |
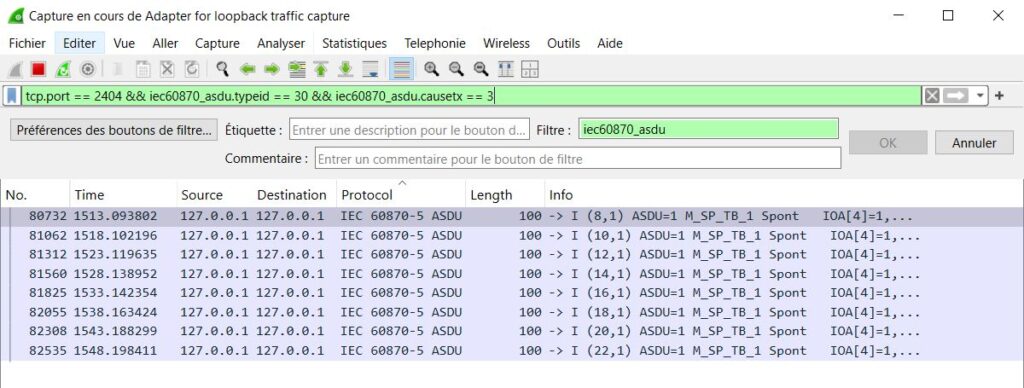
Combine filters for precise troubleshooting, e.g.:
tcp.port == 2404 &&iec60870_asdu.typeid == 30&&iec60870_asdu.causetx == 3
ASDU Type IDs in IEC 60870-5-104
In Wireshark, the ASDU Type ID identifies what kind of process information is being transmitted — such as measurements, events, or commands.
Each type has a specific structure defined in IEC 60870-5-101/104 Communication Protocol.
Wireshark automatically decodes these Type IDs and displays them under the “IEC 60870-5-104 ASDU” tree.
Here’s a reference list of the most commonly used Type IDs you’ll encounter during IEC 104 packet analysis:
| Type ID | ASDU Name | Description / Usage |
|---|---|---|
| 1 | M_SP_NA_1 | Single-point information (no timestamp) |
| 2 | M_SP_TA_1 | Single-point with CP24Time2a timestamp |
| 3 | M_DP_NA_1 | Double-point information (no timestamp) |
| 4 | M_DP_TA_1 | Double-point with timestamp |
| 5 | M_ST_NA_1 | Step position information |
| 9 | M_ME_NA_1 | Measured value, normalized |
| 11 | M_ME_NC_1 | Measured value, short floating point |
| 13 | M_IT_NA_1 | Integrated totals (counters) |
| 30 | M_SP_TB_1 | Single-point with CP56Time2a timestamp |
| 31 | M_DP_TB_1 | Double-point with CP56Time2a timestamp |
| 32 | M_ST_TB_1 | Step position with CP56Time2a timestamp |
| 34 | M_ME_TB_1 | Measured value (normalized, CP56Time2a) |
| 36 | M_ME_TD_1 | Measured value (short float, CP56Time2a) |
| 37 | M_IT_TB_1 | Integrated totals with timestamp |
| 45 | C_SC_NA_1 | Single command (control direction) |
| 46 | C_DC_NA_1 | Double command |
| 47 | C_RC_NA_1 | Regulating step command |
| 58 | C_SC_TA_1 | Single command with timestamp |
| 70 | M_EI_NA_1 | End of initialization |
| 100 | C_IC_NA_1 | Interrogation command |
| 103 | C_CS_NA_1 | Clock synchronization command |
| 104 | C_TS_TA_1 | Test command |
| 120 | F_FR_NA_1 | File ready / file transfer initiation |
| 121 | F_SR_NA_1 | Section ready |
| 122 | F_SC_NA_1 | Segment command |
| 123 | F_LS_NA_1 | Last segment |
| 124 | F_AF_NA_1 | File activation |
Cause of Transmission (COT) in IEC 60870-5-104
Every ASDU in IEC 104 contains a field called the Cause of Transmission (COT) — a critical part of the protocol that tells why a message was sent.
In Wireshark, this field appears immediately after the Type ID inside the ASDU and helps identify the origin, purpose, and flow of the data.
What Is the Cause of Transmission?
The COT describes the reason for sending the ASDU — for example, whether it’s a spontaneous event, a response to a command, or part of initialization.
It also includes two flag bits:
- P/N (Positive/Negative Confirmation Bit) — Indicates success or failure of a command or response.
- T (Test Bit) — Used for test frames.
Common COT Values and Meanings
| COT Code (Decimal) | Mnemonic | Meaning | Typical Direction |
|---|---|---|---|
| 1 | PER / Periodic / Cyclic | Cyclic transmission of data (polling cycle). | Monitor (Slave → Master) |
| 2 | BG / Background Scan | Background integrity transmission. | Monitor |
| 3 | SP / Spontaneous | Event-driven data change. | Monitor |
| 4 | IQ / Initialization | Sent after power-up or reset. | Monitor |
| 5 | REQ / Request / Activation | Command activation request. | Control (Master → Slave) |
| 6 | ACTCON / Activation Confirmation | Acknowledgment of command reception. | Control |
| 7 | DEACT / Deactivation | Deactivation of previously activated command. | Control |
| 8 | DEACTCON / Deactivation Confirmation | Acknowledgment of deactivation. | Control |
| 9 | ACTTERM / Activation Termination | Command completed successfully. | Control |
| 10 | RETREM / Return Information Cause Remote Command | Return info from remote operation. | Monitor |
| 11 | RETLOC / Return Information Cause Local Command | Return info from local operation. | Monitor |
| 20 | FILE / File Transfer Ready | Used in file transfer ASDUs. | Monitor |
| 21 | INTR / Interrogation Command | General interrogation initiated. | Control |
| 40 | REMOTE / Remote Test / Parameter Change | Used in parameter activation. | Control |
| 44 | TEST / Test Frame | Sent during test operation. | Both |
| 45 | RESET / Reset Process | System reset sequence. | Control |
| 70 | END / End of Initialization | Indicates device is ready for operation. | Monitor |
Note: Actual implementations often use codes 1–9 most frequently in normal operation.
Decoding CP56Time2a Timestamps
Wireshark automatically interprets CP56Time2a timestamps and displays the human-readable date and time.
Example:
Timestamp: 2025-10-30 14:15:12.987
If time appears incorrect:
- Verify time zone settings under Wireshark → Preferences → Time Display Format.
- Ensure your SCADA master and RTUs are synchronized (NTP or GPS).
For deeper understanding, read: IEC 104 Time Synchronization (CP56Time2a)
Troubleshooting with Wireshark
| Symptom | Possible Cause | How to Detect in Wireshark |
|---|---|---|
| Frequent TCP reconnects | Timeout (t1/t3) too short | Look for frequent FIN and SYN frames |
| Lost acknowledgments | High latency or overload | Missing S-format responses |
| Duplicated frames | Retransmissions | TCP Retransmission messages |
| No data flow | Link not started | Missing STARTDT CON U-frame |
| Timestamp errors | Clock sync failure | Incorrect CP56Time2a values |
Pro Tip:
Colorize frame types (I, S, U) in Wireshark View → Coloring Rules for quick visual troubleshooting.
Next Step: Decode Frames Instantly Online
Want to decode IEC 104 packets without Wireshark setup?
Use the IEC 60870-5-104 Frame Decoder to analyze real frame data — including ASDU type, timestamp, and Cause of Transmission.